Data Governance
Metropolitan Management using
desicion based on Urban Data Science
Data is a star of decision-making processes throughout all Municipal Management, the timely and accurate provision of the same to each leader, allows to improve the effectiveness and efficiency of this complex process. In this virtual space we take a look in a particular way at Urban Data Sciences and the details of the technological innovations that it contributes and that allow providing contributions to the diagnosis and decision making in the City. In a practical way, this management approach was applied by a team of young officials from the MML during the administration that is now ending, in humanitarian aid processes during the pandemic, with great success, recognized in recent months with awards for excellence in public management.

Context of access to information at the beginning of Management
Each new municipal management faces the typical stages of popularity or rejection linked in some way to political contexts or the order of the social demands of the moment. The campaign proposals initially attracting votes, are the reason, from the beginning of the administration, for great expectations on the part of the Citizenship in relation to the incoming burgomaster, especially during the first year. Unfortunately, the overwhelming demand for hours that it takes each rookie employee to go through the learning curve, creates a transition period until reaching a sufficient level of efficiency in the administration of the services that the city provides, which diverts efforts and time .
After this initial stage, the pressure on officials to face the day-to-day demands requires, among other issues, fresh information that allows a rapid dimensioning of the multiple problems and the respective solutions. The reality is that much of this information does not It is not systematized or structured in a single repository at the Municipal Corporation level and in the case of Metropolitan Lima, the Decentralized Public Organizations (OPD), linked to the MML, have independent information systems in many cases that are not structured in databases either. . An additional issue in relation to the data is the almost 100% absence of geospatial data recording in relation to metropolitan interventions, that is, “where the intervention is being carried out beyond the qualitative reference” or “what territorial scope of coverage has the programmed or analyzed intervention» .
Even more, having as a great hat of knowledge the urban sciences, which understand and explain the dynamics of the City as a whole, there are few operational managers who make use of basic Urban Planning concepts, such as the strengthening and creation of urban centralities with the In order to generate economic development or growth models based on artificial intelligence, which allow simulating growth based on multiple scenarios, just as large cities operate, even more so with about 115,000 blocks, beyond the district political limits, They have a dynamic based on agglomerations of services.
In this article we will deal with the application of the decision-making approach based on qualitative, quantitative and geospatial Data Sciences, which allow optimizing man-hour resources, since each “metropolitan intervention” is analyzed and projected using multiple approaches, of pros and cons through spatial data analysis tools when necessary and traditional statistics when relevant. In this way, the impacts of defining particular localized Management strategies by many Managements is channeled into a Data-Based Management approach.
Geospatial data as an integration agent between data from different management units
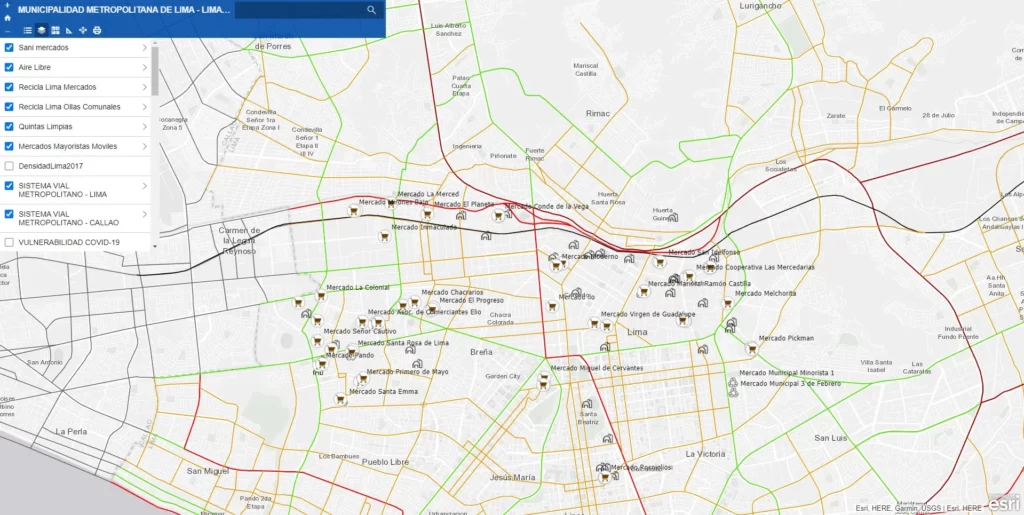
Data structure from different management units at municipalities in order to obtain a single knowledge source is not an easy task, even more, it’s more difficult if you want to additionally include spatial data in this common repository. For instance, geolocation on a map of public those investment projects that are already approved but still not executed by the Planning Department and overlapping them with extreme poverty areas based on statistics per block managed by the IMP, is a very efficient information management strategy for prioritization in their execution, due to limited funds. Another example is shown by Commercial Licenses granted by the Economic Development Management and the Tourist Spaces that are managed by the Tourism Sub-Management . These two previous items were spatially analyzed with the access routes to the latter, both as public transport routes and bicycle routes, managed by the Urban Mobility Management, Sub-Management of non-motorized mobility, and the General Directorate of Roads and Transport at the Metropolitan Planning Institute. All this last package at the service from these FOUR MANAGEMENT UNITS, which allows synergies for their own administration, as well as valid information for the general public.
As we can see, the map becomes an integrating tool for management units, why? Because the actions not only of these 4 groups of officials occur in the same physical space, called urban land. Taking this factual issue to concepts of digital transformation, the spatial type variable is vital and structuring for the dreamed integration of information between any management unit of the Municipality of Lima and any other local government
Because actions not only from these 4 groups of officials occur in the same physical space, called urban land. Taking this factual issue to concepts of digital transformation, the spatial type variable is vital and structuring for the dreamed integration of information between any management unit of the Municipality of Lima and any other local government.
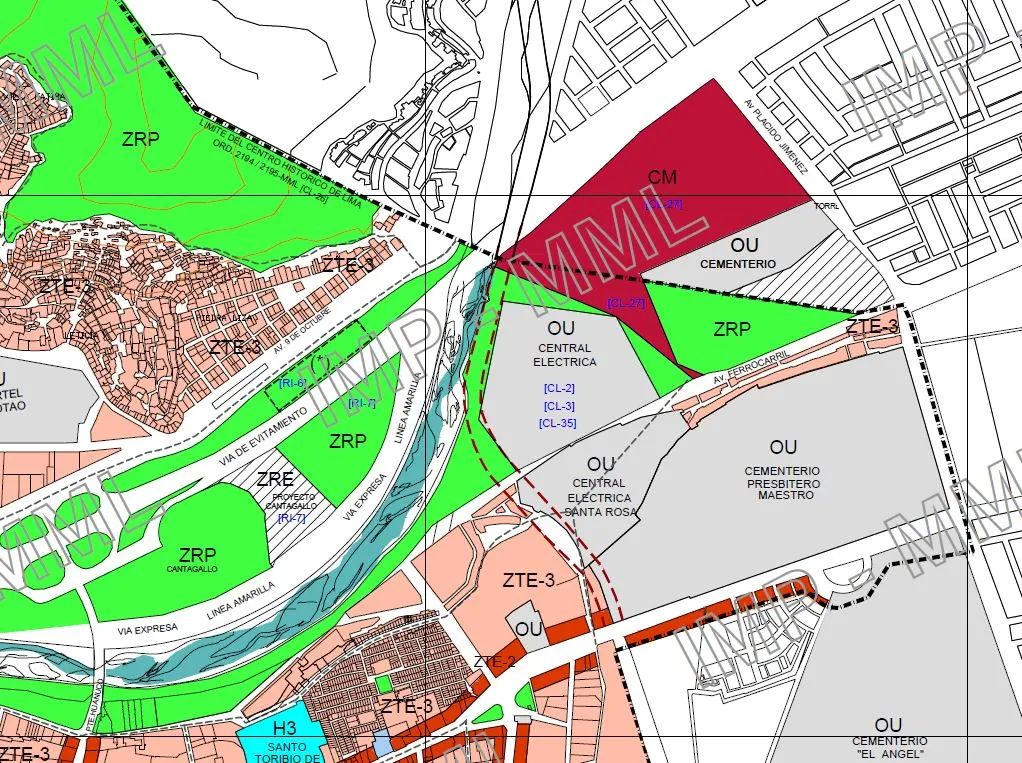
Problems around geodata out of a Geodatabase
The shown map is not hosted in a structured database, it is basically a digital representation, in this case in PDF format. It is not possible to make inquiries, and it is not possible to know which cadastre lots (for example), are larger than 500 m2. In any case, the calculations must be made on each lot, keep track of them and thus be able to answer the question, obviously as many times as there are lots in the area of our interest.
This is a common case in municipal management units in which, despite managing and generating spatial data, these are not saved in appropriate Databases (Geodatabases). Limiting the exploitation of potential knowledge that could be generated.
Limitations of using non-spatialized data

On the other hand, almost 100% of the data that is stored for urban processes monitoring is only of a qualitative or quantitative nature. Which is analyzed using traditional statistical tools, either to create characterization or prediction models. If you want to unify institutional information, it is always necessary to find a common datum, this datum is the location or geographic coordinate, which allows you to use the same environment that is a map or urban space, thus creating synergies that are impossible to model using non-spatialized data.
Structured and integrated Spatial Data at metropolitan scale
Since 2019, the process of building a structured and integrated spatial database with a metropolitan scale began at the Metropolitan Planning Institute, in order to have initial cartography for the development of the City’s urban diagnosis. (PLANMET2040). This type of structured repository contains diverse data, such as the base satellite image of the City from Huaral to Mala, approximately 114,000 blocks with statistical data from the INEI 2017 census, the Metropolitan Road System, current land use by blocks, urban zoning, educational and health infrastructure, urban land value, public recreation spaces, etc.
Using this platform, which was originally designed exclusively to support Urban Planning processes, key information was efficiently generated from April 2020 to date in order to support decision-making from multiple operational management units of the Metropolitan Municipality of Lima, a data-based initiative triggered by the Municipal Management due to the need to refine the precision with which urban spaces were selected for humanitarian aid purposes activities during the beginning of Covid-19 infections.
A more detailed and expanded explanation will be presented in a future entry of this BLOG, in order to draw up a kind of Roadmap that can be replicated in other Cities. Below are some specific cases of this set of data-based decision-making, which were taken very close to the evidence offered by the information extracted from data of a quantitative, qualitative, and spatial nature of the Corporate Database from the Metropolitan Institute of Planning of the City of Lima.
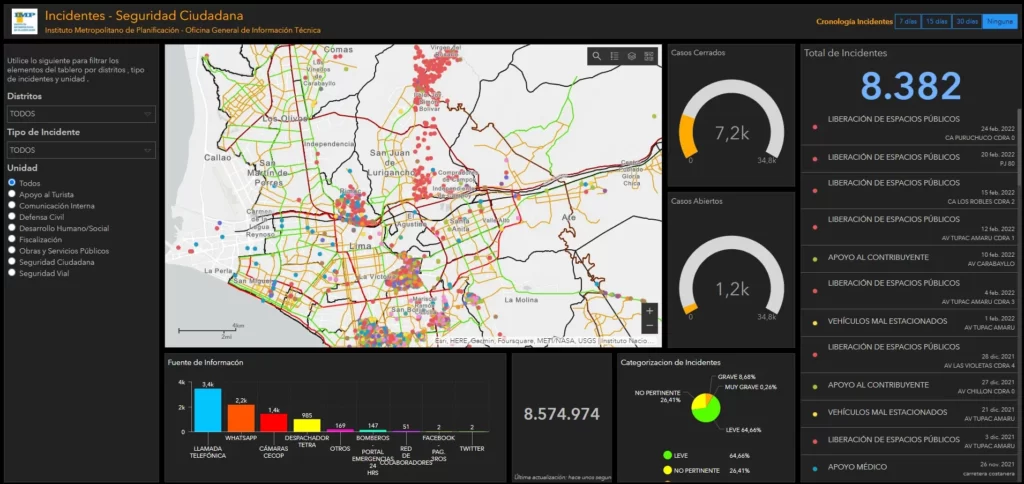
Citizen Security Observatory
The Citizen Security Event Viewer. designed for the Observatory of Citizen Security of the Municipality of Lima (shown in the attached image), shows different variables managed by the Security Management Units, the map per se as an integrating tool presents an ideal scenario for the unification of interventions monitoring in Cities, since it groups, in a single tool, actions carried out by multiple departments in a simple and intuitive way, being accessible through any Web browser or any mobile device. The tool shown data entered by more than 220 registered users in more than 20 districts of the Municipality of Metropolitan Lima (at least until May 2022). This WebApp was not originally designed for real-time data entry, but for ex-post statistical purposes, but in some districts such as Carabayllo, at one point it supported the daily planning for security patrols , through the review on this virtual map shown of the places that until the night before had been registered the ” units interventions arond criminal acts”, and therefore, became “potential risk areas for the population”.
Support to Communal Pots and general Food Security
As part of the support to the Humanitarian Aid processes, priority has been given to the attention of urban spaces where vulnerable populations live, to the maintenance of adequate food. That is why, from the “Lima Te Cuida” program and under the direct management of the Municipal Management, it was deemed appropriate to implement not only statistical monitoring of the multiple interventions in the Territory, but also strict monitoring of the specific places where these residents resided. sources of vulnerability to COVID-19 infections. Always having as a base spatial and statistical data platform, the one developed from the Metropolitan Planning Institute.
Having as operating actors of this initiative multiple departments, such as the Social Development Management, Citizen Participation Management, City Services and Environmental Management Management, Economic Development Management as well as the Regional Government of Lima and the Lima Foundation and In the absence of an integrated Information System between these Management units, the use of the geospatial interface as an “integrating and articulating element” was key, since urban land is a common element precisely to all the aforementioned actors for compliance of their day-to-day tasks, especially during the emergency situation and having as an incentive to mitigate the very high number of cases of deaths per day, which demanded efficiency as an essential requirement in order to avoid them.
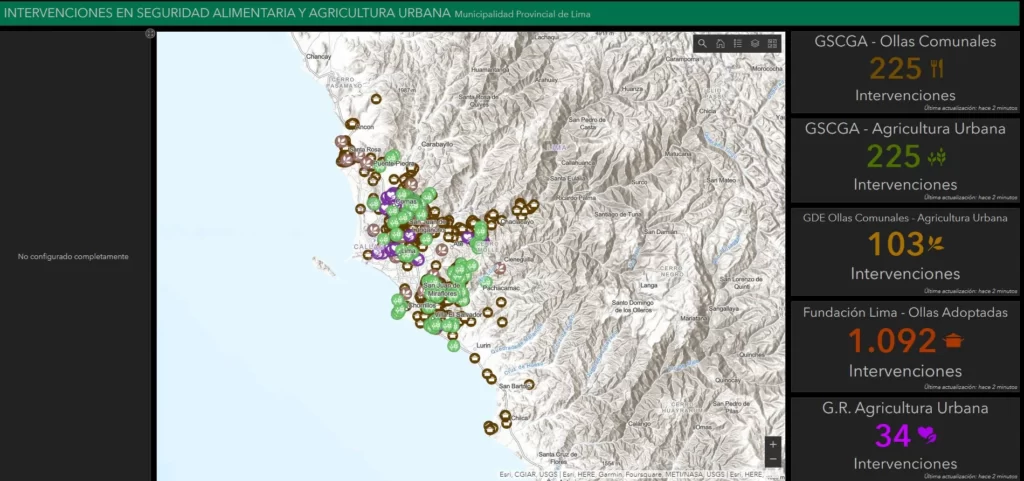
Fundación Lima with the initiative “Ollas Adoptadas” and the Management of Services to the City and Environmental Management with “Ollas Comunales”, could already verify on the virtual map provided by the WebMap App and from their own cell phones, the spaces that had already been intervened and thus be able to be more efficient in the administration of locating new spaces. Subsequently, the interventions of “Urban Agriculture” were added to promote and train the residents to sow and harvest their own food or as support for the Communal Pots, this initiative also had two actors, the City Services Management as well as the Regional Government, thus being able to maximize the efficiency of this initiative in the homogeneity of the coverage of the interventions that they executed, through this sophisticated tool, placed in the hands of those who made decisions on a daily basis.
Municipal Program "Go Back Home"